The Operational Complexity Framework™
TWGA’s proprietary methodology for measuring and managing operational burden. A systems-based evaluation of the interconnected factors that drive complexity and determine operational resilience in modern aviation ecosystems.
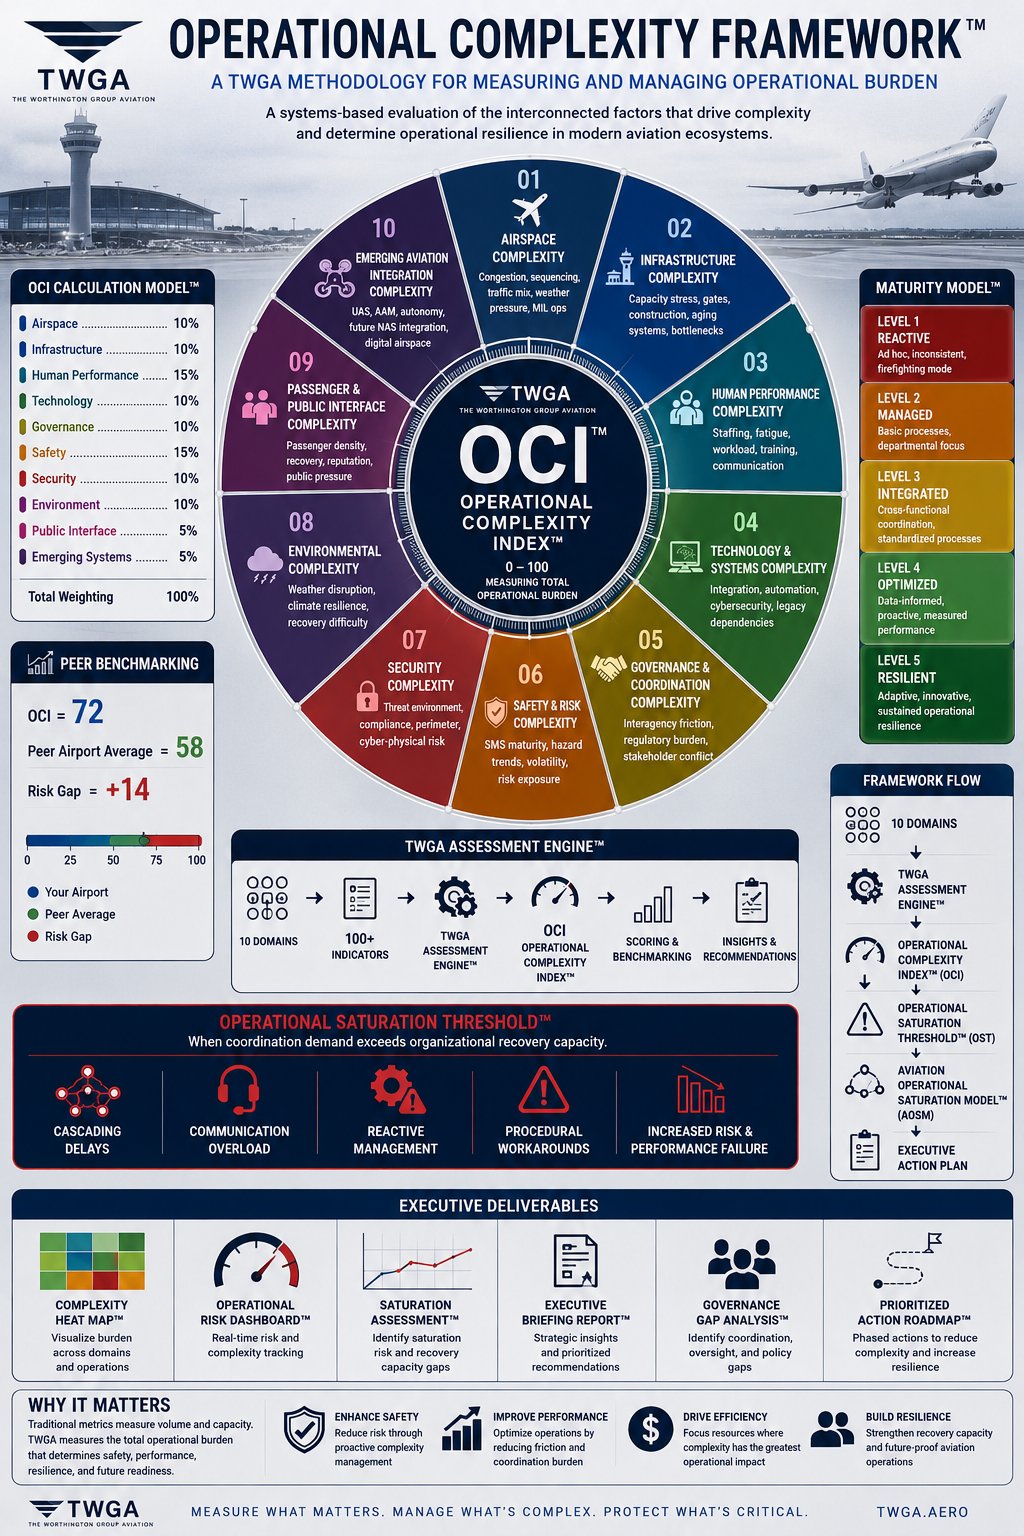
From 10 domains and 100+ indicators to a single Operational Complexity Index™.
The Operational Complexity Framework™ (OCF) evaluates 10 operational domains and converts 100+ indicators into a single Operational Complexity Index™ (OCI) that helps leaders identify hidden operational strain before it becomes a safety, financial, or organizational crisis.
Traditional metrics measure volume and capacity. TWGA measures the total operational burden that determines safety, performance, resilience, and future readiness — across airspace, infrastructure, people, technology, governance, safety, security, environment, public interface, and emerging systems.
A systems view of operational burden — not just throughput.
The OCF maps the interconnected factors that drive complexity across the entire aviation operating environment.
Congestion, sequencing, traffic mix, weather pressure, military operations.
Capacity stress, gates, construction, aging systems, bottlenecks.
Staffing, fatigue, workload, training, communication.
Integration, automation, cybersecurity, legacy dependencies.
Interagency friction, regulatory burden, stakeholder conflict.
SMS maturity, hazard trends, volatility, risk exposure.
Threat environment, compliance, perimeter, cyber-physical risk.
Weather disruption, climate resilience, recovery difficulty.
Passenger density, recovery, reputation, public pressure.
UAS, AAM, autonomy, future NAS integration, digital airspace.
The Operational Complexity Index™ (OCI).
A weighted 0–100 score capturing total operational burden across the ten domains. Higher scores indicate higher coordination demand, greater fragility, and accelerating saturation risk.
The model intentionally weights Human Performance and Safety highest (15% each) because these are the domains where operational burden most directly converts into safety, performance, and resilience outcomes.
The 0–100 scale reads:
Stable · Elevated · Complex · Highly Complex · Operationally Saturated
Domain Weighting
| Airspace | 10% |
| Infrastructure | 10% |
| Human Performance | 15% |
| Technology | 10% |
| Governance | 10% |
| Safety | 15% |
| Security | 10% |
| Environment | 10% |
| Public Interface | 5% |
| Emerging Systems | 5% |
| Total Weighting | 100% |
Six structured steps from environment to executive action.
When coordination demand exceeds organizational recovery capacity.
The Operational Saturation Threshold™ (OST) is the inflection point at which an organization shifts from sustainable operations into reactive crisis management. The OCF flags five observable symptoms that signal saturation is imminent or active:
Cascading Delays
Single-point disruptions ripple outward across schedules, gates, and adjacent airspace because there is no slack left in the system to absorb them.
Communication Overload
Voice loops, coordination channels, and stakeholder briefings exceed the cognitive bandwidth of operators and leaders.
Reactive Management
Leadership shifts from strategic decision-making to incident response — planning horizons compress from quarters to hours.
Procedural Workarounds
Operators improvise outside documented procedures because the documented path can no longer absorb the operational reality.
Increased Risk & Performance Failure
Safety margins narrow, throughput degrades, incidents rise, and recovery time elongates with each successive disruption.
When OST Is Active
The organization is no longer operating its environment — the environment is operating the organization. The OCF surfaces this signal early.
Five levels from reactive to resilient.
The OCF measures not just current complexity but the organizational maturity to manage it — on a five-level scale that maps directly to executive action.
Reactive
Ad hoc, inconsistent, firefighting mode.
Managed
Basic processes, departmental focus.
Integrated
Cross-functional coordination, standardized processes.
Optimized
Data-informed, proactive, measured performance.
Resilient
Adaptive, innovative, sustained operational resilience.
Seven artifacts every assessment produces.
Each Operational Complexity Assessment™ closes on a structured executive package — not a slide deck.
Complexity Heat Map™
Visualize burden across domains and operations.
Operational Risk Dashboard™
Real-time risk and complexity tracking.
Saturation Assessment™
Identify saturation risk and recovery capacity gaps.
Executive Briefing Report™
Strategic insights and prioritized recommendations.
Governance Gap Analysis™
Identify coordination, oversight, and policy gaps.
Prioritized Action Roadmap™
Phased actions to reduce complexity and increase resilience.
Peer Benchmarking
Compare your OCI score against peer airports and aviation organizations.
The OCF wasn’t invented in a workshop — it was built from three decades of operational reality.
Dr. Worthington’s experience spans the full aviation ecosystem: military air traffic control, international tower operations, major airport leadership, humanitarian airlift, and FAA NAS modernization. The OCF translates that operational experience into a methodology airports, agencies, and contractors can apply.
See the Experience That Shaped the Framework →Ready to measure what matters?
Request an Operational Complexity Assessment™ and receive a full OCI score, heat map, executive briefing, and 30-60-90 day action plan within three to four weeks.